150-Year Analysis: What Happens to Equities When Inflation Strikes?


The quick rise in consumer prices following the pandemic disrupted decades of low inflation globally and sparked equity volatility that investors still struggle to navigate. While inflation has settled down, it has stubbornly stayed above central banks’ targets of around 2%. High inflation can cut out the bulk of a portfolio’s return, making it a paramount concern for investors.
To better understand how inflation impacts investors’ portfolios, we examined the sensitivity of equity returns to inflation over nearly 150 years, from 1875 to 2023. A rigorous analysis of inflation’s impact on investing requires this extensive history because periods of high inflation have been rare. Before the pandemic, global inflation had hovered around 2% for 50 years, never exceeding 4% from 1990 to 2020. In fact, there have only been a few periods of significant inflation in the past 150 years: the 1880s, after World War I, around World War II, the 1970s oil crisis, and most recently since the end of 2021.
To provide a more diverse view of options for investors’ portfolios beyond the broad stock market, we investigated the inflation sensitivity of common equity factors. These five equity factors — notable for their ability to outperform historically — are small caps, value, momentum, low volatility equities, and quality. We also combined these factors equally into a single multi-factor portfolio.
The Sensitivity of Performance to Inflation
Over the full period, equities returned 8.3% a year on average before inflation, with inflation averaging 3.3%. Notably, the five equity factors all delivered a performance premium (outperformed the broad market) with average annual returns ranging from 9.4% for small caps to 11.7% for momentum. The multi-factor portfolio yielded a robust annualized return of 10.6%.
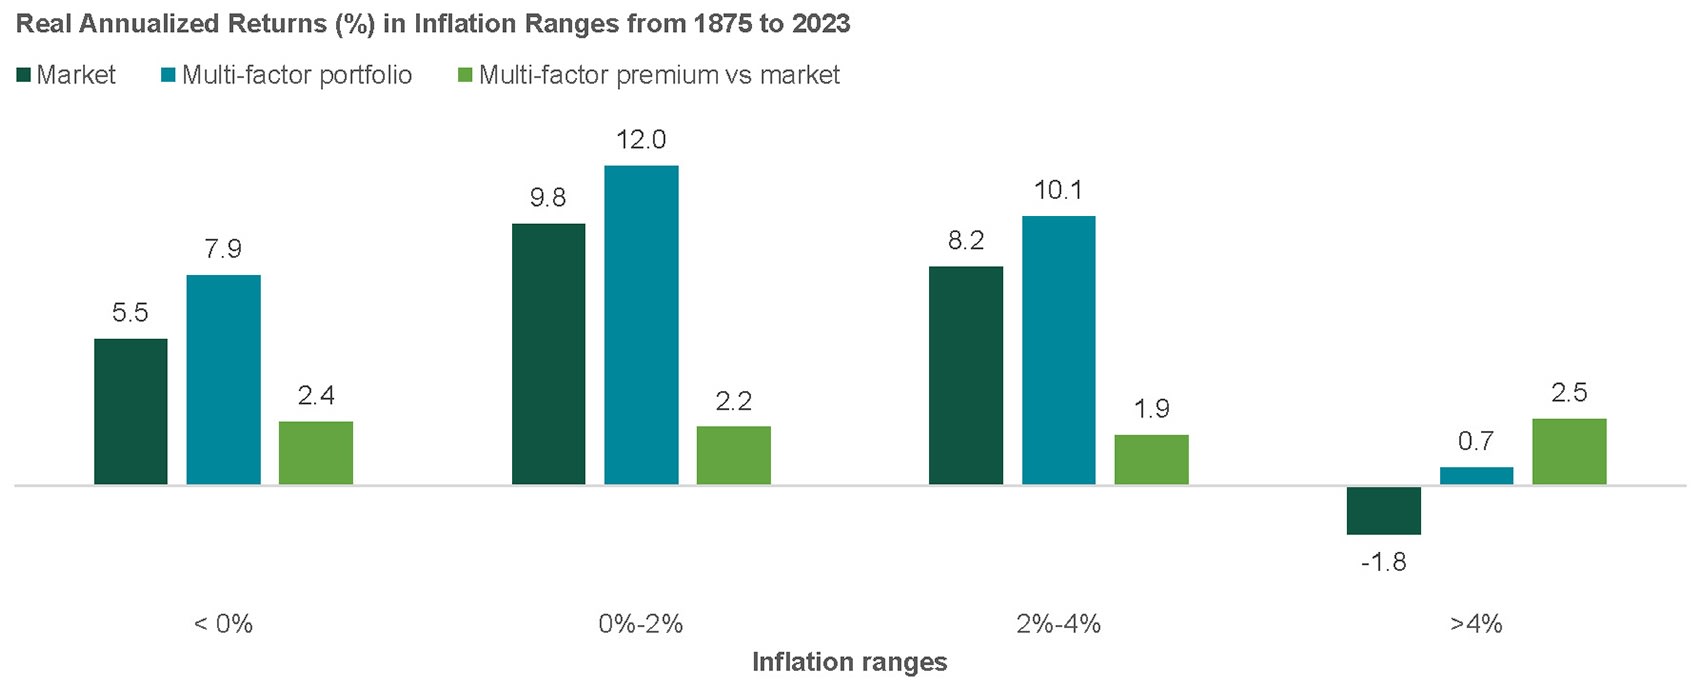
To see how varying levels of inflation impacted the equity market and these premiums, we examined equity returns across four inflation buckets: 1) below 0%, or deflation, 2) between 0% and the current central bank target of 2%, 3) a mild inflation overshoot, between 2% and 4%, and 4) high inflation, above 4%. We show the results in Exhibit 1. Notably, equities performed the best in periods of low-to-moderate inflation but turned negative in times of high inflation.
In contrast, equity factor premiums demonstrated consistent performance across the varying levels of inflation. Exhibit 1 shows that the multi-factor strategy delivered positive real annualized returns across all inflationary scenarios, averaging a 2.3% premium over the broad market. The multi-factor portfolio provided real returns of 7.9% in deflation, 12.0% in moderate inflation, 10.1% during in an inflation overshoot, and 0.7% in high inflation (when the broad market averaged a loss).
Exhibit 1: A Multi-Factor Premium Across Inflation Levels
While equity returns varied significantly with the level of inflation, equity factors maintained a consistent premium to the market.
Source: Northern Trust. Factors are simulated. Data from January 1875 until November 2023, except for the quality factor which starts in 1940. The multi-factor series includes all factors available at each point in time. We used the dataset on U.S. equity factors compiled by Baltussen, Vidojevic & van Vliet (2023), and combine this with data from Wahal (2019). We extend this data until November 2023 with data from the Kenneth French data library to include the most recently made available data. Returns are inflation-adjusted, in annual terms, in U.S. dollars and averaged across inflationary scenarios. Past performance is not indicative of future results.
Performance During the Recent Inflation Spike
While a very short time frame in context of this study, it’s worth looking at what’s happened in the most recent period of high inflation. Inflation during 2021, 2022, and 2023 was 5.0%, 8.0%, and 3.6%, respectively. During that three-year period, the value, momentum, low volatility, quality, and the multi-factor portfolios outperformed the market while small caps underperformed. The performances of value and quality stand out the most, with the market lagging these factors by over 5%.
We also split the sample into two scenarios: 1) when inflation is high but decreasing and 2) when inflation is high and increasing. In both scenarios, all factor portfolios show positive real returns with the exception of small caps in the increasing inflation case. The multi-factor portfolio outperformed the market by 3% on average annually in both cases.
How Equity Factors May Help Mitigate Inflation Damage
Our analysis shows a history of positive real stock returns during periods of deflation and moderate inflation. However, stocks had losses during periods of high inflation, presenting a substantial challenge for investors. In contrast, factor premiums exhibit a noteworthy consistency across all inflation regimes, with minimal variation in average returns. While this might sound unexciting, it underscores that factor investors, on average, experienced less vulnerability to inflation. History shows that investors who construct their equity portfolios using equity factors can outperform the market amid low or moderate inflation and mitigate the damage when high inflation strikes.
This analysis is based on Northern Trust Asset Management’s 2024 paper “Navigating Inflation — An Analysis of Equity Factor Performance over 150 Years” by Baltussen, Vidojevic, and van Vliet
You can also watch our supporting webinar on-demand now.
Important Information
Factor definitions: The small cap factor targets companies with small market capitalizations versus the broad equity market. The value factor targets companies with low stock price valuations. The momentum factor targets companies that have strong stock price and analyst sentiment. The low volatility factor targets companies with less volatility in stock price and financial fundamentals. The quality factor targets companies with efficient management, profitability and strong cash flows.
For Asia-Pacific (APAC) and Europe, Middle East and Africa (EMEA) markets, this information is directed to institutional, professional and wholesale clients or investors only and should not be relied upon by retail clients or investors. For US NTAM, the information contained herein is intended for use with all current or prospective clients of Northern Trust Investments, Inc (NTI).
Northern Trust Asset Management (NTAM) is composed of Northern Trust Investments, Inc., Northern Trust Global Investments Limited, Northern Trust Fund Managers (Ireland) Limited, Northern Trust Global Investments Japan, K.K, NT Global Advisors, Inc., 50 South Capital Advisors, LLC, Northern Trust Asset Management Australia Pty Ltd, and investment personnel of The Northern Trust Company of Hong Kong Limited and The Northern Trust Company.
Issued in the United Kingdom by Northern Trust Global Investments Limited regulated by the Financial Conduct Authority (Licence Number 191916), issued in the European Economic Area (“EEA”) by Northern Trust Fund Managers (Ireland) Limited regulated by the Central Bank of Ireland (Licence Number C21810) , issued in Australia by Northern Trust Asset Management (Australia) Limited (ACN 648 476 019) which holds an Australian Financial Services Licence (License Number: 529895) and is regulated by the Australian Securities and Investments Commission (ASIC), and issued in Hong Kong by The Northern Trust Company of Hong Kong Limited which is regulated by the Hong Kong Securities and Futures Commission.
This information is directed to institutional, professional and wholesale current or prospective clients or investors only and should not be relied upon by retail clients or investors. The information is not intended for distribution or use by any person in any jurisdiction where such distribution would be contrary to local law or regulation. NTAM may have positions in and may effect transactions in the markets, contracts and related investments different than described in this information. This information is obtained from sources believed to be reliable, its accuracy and completeness are not guaranteed, and is subject to change. Information does not constitute a recommendation of any investment strategy, is not intended as investment advice and does not take into account all the circumstances of each investor.
This report is provided for informational purposes only and is not intended to be, and should not be construed as, an offer, solicitation or recommendation with respect to any transaction and should not be treated as legal advice, investment advice or tax advice. Recipients should not rely upon this information as a substitute for obtaining specific legal or tax advice from their own professional legal or tax advisors. References to specific securities and their issuers are for illustrative purposes only and are not intended and should not be interpreted as recommendations to purchase or sell such securities. Indices and trademarks are the property of their respective owners. Information is subject to change based on market or other conditions.
All securities investing and trading activities risk the loss of capital. Each portfolio is subject to substantial risks including market risks, strategy risks, advisor risk, and risks with respect to its investment in other structures. There can be no assurance that any portfolio investment objectives will be achieved, or that any investment will achieve profits or avoid incurring substantial losses. No investment strategy or risk management technique can guarantee returns or eliminate risk in any market environment. Risk controls and models do not promise any level of performance or guarantee against loss of principal. Any discussion of risk management is intended to describe NTAM’s efforts to monitor and manage risk but does not imply low risk.
Past performance is not a guarantee of future results. Performance returns and the principal value of an investment will fluctuate. Performance returns contained herein are subject to revision by NTAM. Comparative indices shown are provided as an indication of the performance of a particular segment of the capital markets and/or alternative strategies in general. Index performance returns do not reflect any management fees, transaction costs or expenses. It is not possible to invest directly in any index. Net performance returns are reduced by investment management fees and other expenses relating to the management of the account. Gross performance returns contained herein include reinvestment of dividends and other earnings, transaction costs, and all fees and expenses other than investment management fees, unless indicated otherwise. For U.S. NTI prospects or clients, please refer to Part 2a of the Form ADV or consult an NTI representative for additional information on fees.
Forward-looking statements and assumptions are NTAM’s current estimates or expectations of future events or future results based upon proprietary research and should not be construed as an estimate or promise of results that a portfolio may achieve. Actual results could differ materially from the results indicated by this information.
© 2024 Northern Trust Corporation. Head Office: 50 South La Salle Street, Chicago, Illinois 60603 U.S.A.
For US Financial Institutional Client Distribution: NOT FDIC INSURED | MAY LOSE VALUE | NO BANK GUARANTEE
P-051624-3577605-051625

Northern Trust
Northern Trust Asset Management is an investment management firm entrusted by investors around the globe to help them na...
AUTHOR

Partner Article
Our partner businesses are invited to pen articles that offer unique insight from within the industry for the benefit of our readers. If you read something you would like to learn more about you can contact our partners direct or we are happy to put you in touch.
Recommended for you
Everyone has their own reason for wanting to stay healthier, for longer.As a super fund, you're in a unique position to ...


The evolution of financial technology continues accelerating with the emergence of high-speed blockchain networks that e...


Australian property prices are rising again, presenting a compelling opportunity for investors. For the first time in fo...


For the first time in four years, every Australian capital city recorded simultaneous quarterly price growth—fuelle...


TOP PERFORMING FUNDS
ACS FIXED INT - AUSTRALIA/GLOBAL BOND
Fund name
3y(%)pa
1
DomaCom DFS Mortgage
215.17 3 y p.a(%)
2
Lakehouse Small Companies
152.92 3 y p.a(%)
3
Loftus Peak Global Disruption Fund Hedged
118.15 3 y p.a(%)
4
Global X 21Shares Bitcoin ETF
75.00 3 y p.a(%)
5
UBS Solactive Global Pure Gold Miners UCITS ETF Dis USD
61.11 3 y p.a(%)